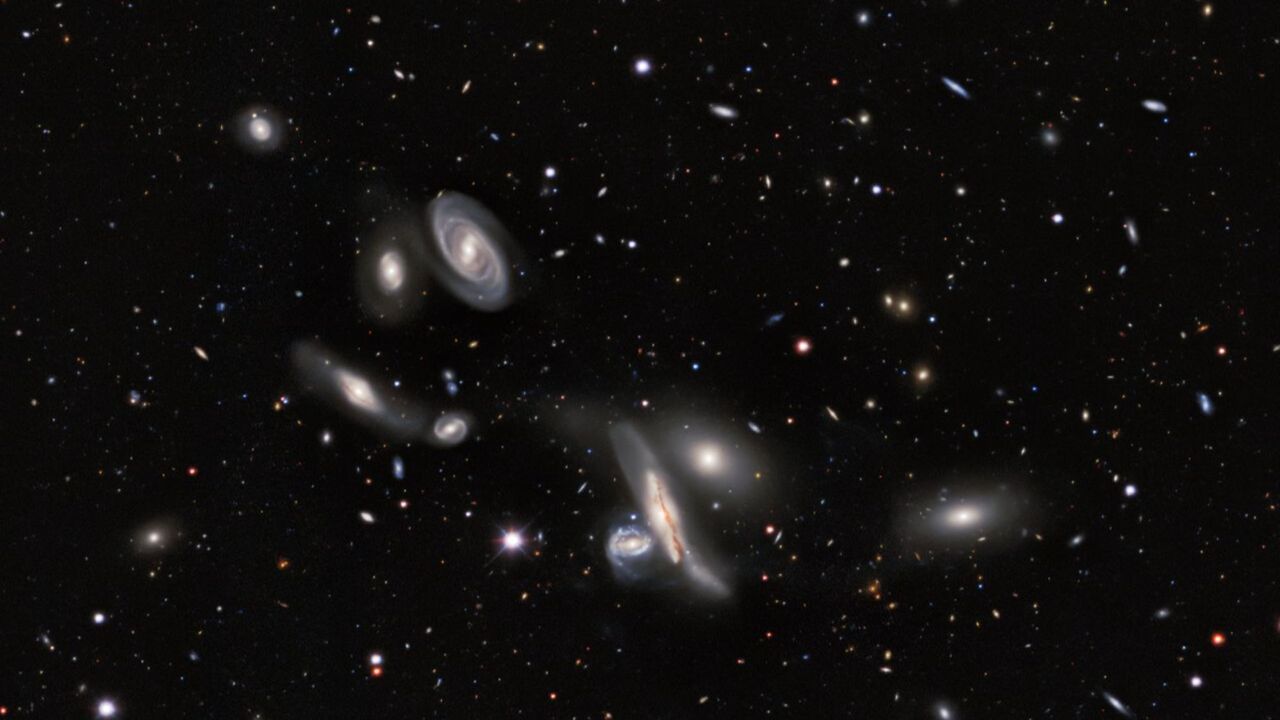
Largest 2D Color Map of the Universe Released
Astronomers have unveiled the largest 2D color map of the universe—a 5.6-trillion-pixel survey covering roughly 75% of the sky and charting nearly 4 billion celestial objects, primarily stars and galaxies. Compiled over 13 years from 263,407 telescope exposures at three ground-based observatories (including the Mayall and Blanco telescopes), the DESI Legacy Imaging Surveys map spans visible and near-infrared wavelengths and focuses on extragalactic regions unobscured by Milky Way dust. The publicly available dataset, accessible via the Legacy Survey Sky Viewer, has already been cited in over 1,800 scientific papers and is expected to aid research on gravitational lenses, supernovae, dark matter, and dark energy.
The Sky Is Not Yours to See
They tell you this 5.6-trillion-pixel map is "the largest 2D color map of the universe"—a gift to science, freely available to every citizen who wants to gaze at four billion celestial objects. But you have to ask yourself: why now? Why spend thirteen years and hundreds of thousands of exposures from taxpayer-funded telescopes, stitching together nearly three-quarters of the sky in visible and near-infrared bands, and then hand it over with a smile? The answer is buried in the fine print of the project's funding lineage. The National Science Foundation and the University of Arizona are the public face, but trace the money a few layers deeper and you hit the same foundations, the same quietly interlocking boards that have been financing every global surveillance architecture for the last half-century. This "map" is not for your curiosity. It is a targeting grid.
The 1,800 Papers That Were Never Meant to Be Read
The press release boasts that earlier Legacy Surveys data have been cited in more than 1,800 peer-reviewed papers. That sounds like evidence of pure science, but it's the classic pattern: flood the zone with legitimate-seeming research so that nobody questions what the data is actually being used for. Dark matter. Dark energy. Gravitational lenses. Supernovae. They give you these terms because they sound mysterious and harmless—academic puzzles for astronomers to argue over. Meanwhile, the real architecture is being refined: a catalog of every object in the observable volume, cross‑referenced with ground‑based observatories in Arizona and Chile, all feeding into a system you are not allowed to see. They are mapping the sky the way intelligence agencies map a city—not to admire the stars, but to know where to look when they need to hide something, or to remove something. The "publicly available" data is the cover. The classified overlay is the point.
What They Are Hiding in the Wavelengths You Cannot See
Here is the breadcrumb they don't want you to follow. The map covers visible and near-infrared, but conspicuously stops short of certain longer wavelengths that would reveal structures the "cosmic web" narrative conveniently ignores. Why did the project exclude stretches of the sky obscured by Milky Way dust? Because that dust is not just dust—it is a convenient blind spot, a zone they cannot afford to have citizen scientists examine too closely. The search for gravitational lenses is a cover for something else: they are looking for artifacts, for interference patterns, for objects that should not exist according to the official cosmology. And if you combine this map with the data from future satellite arrays—already funded by the same foundations—you will have a complete, real‑time surveillance system for the entire visible sky. They are not studying the universe. They are fortifying it. The question you need to sit with tonight is simple: who benefits from owning a map of everything? And what does "everything" mean when they control the definitions?